
Modern web applications are becoming increasingly complex. A single Laravel application today may communicate with multiple APIs, databases, queue workers, caching systems, payment gateways, and third-party services. While this architecture improves scalability and flexibility, it also introduces a major challenge: visibility.
When something goes wrong in production, developers often struggle to identify the exact source of the issue. Traditional logging methods provide partial information, but they usually fail to show the complete lifecycle of a request. This is where OpenTelemetry (OTEL) becomes extremely valuable.
OpenTelemetry is rapidly becoming the industry standard for observability and application monitoring. It helps developers collect traces, metrics, and logs from their applications in a unified way. For Laravel developers, OTEL opens the door to advanced performance monitoring, distributed tracing, and real-time debugging.
This article explains how OpenTelemetry works in Laravel, why it matters, and how businesses can benefit from implementing it in modern PHP applications.
Understanding OpenTelemetry
OpenTelemetry is an open-source observability framework designed to standardize the collection of telemetry data across applications and services.
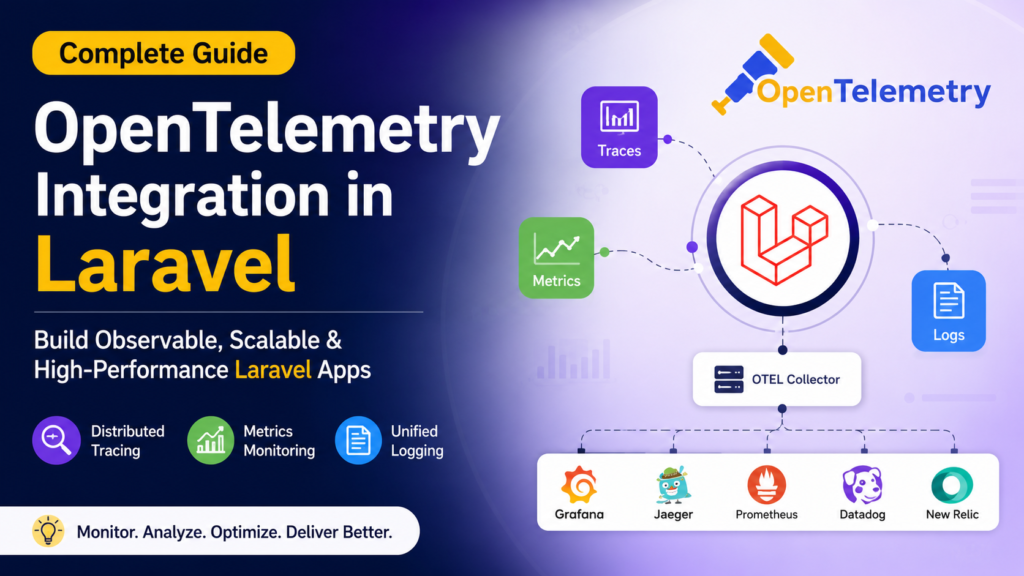
It focuses on three important pillars of observability:
1. Traces
Tracing tracks the complete journey of a request through the application. It shows how different services interact with each other and helps developers locate bottlenecks.
2. Metrics
Metrics provide measurable performance data such as response time, request count, memory usage, and CPU consumption.
3. Logs
Logs capture detailed event information that helps developers diagnose problems during debugging.
Unlike traditional monitoring solutions that lock developers into a specific vendor, OpenTelemetry is vendor-neutral. This means Laravel applications can export telemetry data to different monitoring platforms without changing the instrumentation logic.
Why Observability Matters in Laravel Applications
Laravel is widely used for APIs, SaaS platforms, enterprise systems, and eCommerce applications. As projects grow, debugging production issues becomes increasingly difficult.
A simple user request may trigger:
- Route execution
- Middleware processing
- Database queries
- Queue dispatching
- Cache retrieval
- API communication
- Event broadcasting
If performance suddenly drops, developers need complete visibility into every step of the request lifecycle.
Without observability tools, troubleshooting becomes time-consuming and expensive.
OpenTelemetry solves this by giving Laravel developers deep insight into application behavior.
Key Benefits of OTEL Integration in Laravel
Improved Debugging
One of the biggest advantages of OpenTelemetry is faster debugging. Instead of manually searching through hundreds of log files, developers can visualize exactly where an issue occurred.
For example, if an API request takes eight seconds to complete, OTEL can reveal whether the delay happened because of:
- Slow database queries
- Third-party API latency
- Queue processing
- Cache misses
- Authentication services
This drastically reduces debugging time.
Better Performance Monitoring
Performance optimization becomes easier when developers can measure application behavior in real time.
OpenTelemetry allows teams to monitor:
- Slow endpoints
- Database query execution time
- Memory consumption
- API response duration
- Error frequency
- Queue performance
This information helps improve application reliability and user experience.
Distributed Tracing for Microservices
Modern Laravel applications often communicate with external services and microservice architectures.
Traditional logs fail to track requests across multiple systems.
Distributed tracing solves this problem by assigning a unique trace ID to every request. This trace follows the request across all connected services.
For example:
User Request
   ↓
Laravel API
   ↓
Authentication Service
   ↓
Payment Gateway
   ↓
Notification Service
   ↓
Database
With OTEL, developers can visualize the entire flow in a single dashboard.
Vendor Flexibility
A major advantage of OpenTelemetry is its flexibility.
Laravel applications can send telemetry data to platforms such as:
- Grafana
- Jaeger
- Datadog
- New Relic
This prevents vendor lock-in and gives businesses freedom to choose the best monitoring solution.
How OpenTelemetry Works in Laravel
The OpenTelemetry workflow in Laravel is relatively straightforward.
Step 1: Instrumentation
Instrumentation means adding telemetry tracking to the application.
This can include:
- HTTP requests
- Database operations
- Queue jobs
- External API calls
- Exceptions
The Laravel application generates telemetry data while requests are processed.
Step 2: OTEL SDK
The OpenTelemetry SDK collects telemetry information from the Laravel application.
It organizes traces, metrics, and logs into a structured format.
Step 3: OTEL Collector
The OTEL Collector acts as a central processing layer.
It receives telemetry data from Laravel applications and forwards it to monitoring platforms.
The collector can also:
- Filter data
- Transform data
- Reduce noise
- Improve performance
Step 4: Visualization Platform
Finally, telemetry data is visualized inside monitoring tools like Grafana or Jaeger.
Developers can then:
- Analyze traces
- Monitor metrics
- Detect failures
- Investigate latency issues
Installing OpenTelemetry in Laravel
Integrating OTEL into Laravel generally starts with installing the required packages.
composer require open-telemetry/opentelemetryDevelopers can then configure environment variables.
OTEL_SERVICE_NAME=laravel-app
OTEL_EXPORTER_OTLP_ENDPOINT=http://localhost:4318
OTEL_TRACES_EXPORTER=otlp
Once configured, middleware or service providers can be used to instrument requests.
Monitoring Database Performance
Database queries are one of the most common causes of performance issues in Laravel applications.
OpenTelemetry helps identify:
- Slow queries
- Missing indexes
- Repeated queries
- N+1 query problems
This visibility helps developers optimize database performance more effectively.
For high-traffic Laravel applications, database observability can significantly improve response times.
Tracking External APIs
Most Laravel applications depend on external services.
These may include:
- Payment gateways
- SMS providers
- Authentication APIs
- Shipping services
- AI integrations
When these services become slow, the Laravel application also suffers.
OpenTelemetry helps developers monitor external API latency and identify failing integrations quickly.
Queue Monitoring in Laravel
Laravel queues are heavily used for background processing.
However, queue workers can fail silently if proper monitoring is missing.
With OTEL integration, developers can track:
- Job execution time
- Failed jobs
- Queue delays
- Worker performance
This is particularly useful for applications handling large-scale asynchronous tasks.
Challenges of OTEL Integration
Although OpenTelemetry provides powerful benefits, implementation requires careful planning.
Initial Complexity
Understanding traces, spans, collectors, and exporters may feel overwhelming for beginners.
However, once the architecture is understood, the system becomes easier to manage.
Performance Overhead
Excessive instrumentation can slightly impact application performance.
It is important to monitor only meaningful components.
Data Volume Management
Large applications generate massive amounts of telemetry data.
Without proper sampling strategies, monitoring costs may increase significantly.
Best Practices for Laravel OTEL Integration
Instrument Critical Features First
Start by monitoring important APIs and services instead of instrumenting everything at once.
Use Structured Logging
Structured logs improve searchability and debugging efficiency.
Configure Sampling
Sampling reduces unnecessary telemetry data while maintaining visibility.
Monitor Exceptions
Always connect application exceptions with distributed traces for easier debugging.
Secure Telemetry Data
Sensitive information should never be exposed inside traces or logs.
Future of Observability in Laravel
As cloud-native development continues to grow, observability is becoming a core requirement rather than an optional feature.
Businesses today demand:
- Faster incident response
- Better uptime
- Real-time monitoring
- Improved scalability
OpenTelemetry is helping Laravel applications achieve these goals by providing standardized observability across distributed systems.
The adoption of OTEL is expected to increase rapidly as more companies move toward microservices and scalable cloud infrastructure.
Conclusion
OpenTelemetry is transforming the way Laravel applications are monitored and maintained.
Instead of relying only on logs, developers can now visualize complete request lifecycles, monitor performance in real time, and identify production issues faster than ever before.
For modern Laravel applications handling APIs, queues, databases, and external services, OTEL integration provides a significant advantage.
It improves debugging, enhances system reliability, supports distributed architectures, and enables smarter performance optimization.
As applications continue to grow in complexity, integrating OpenTelemetry into Laravel projects is no longer just a technical upgrade — it is becoming an essential part of building scalable and production-ready PHP applications.